


New Bay Area Travel Study Data Available Via Dashboard
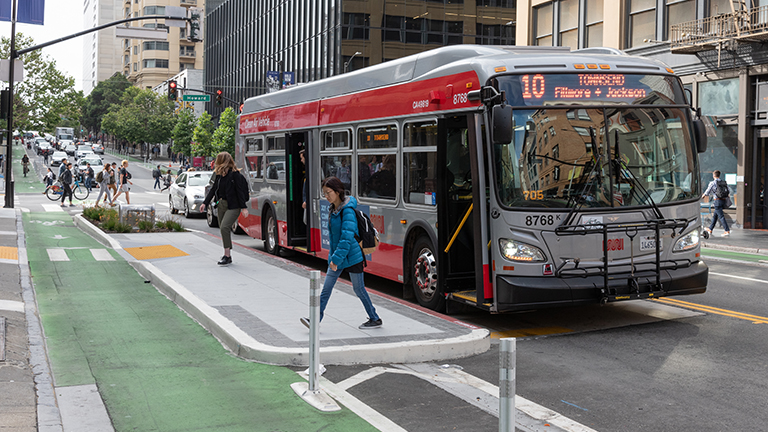
A new Bay Area Travel Study (BATS) dashboard is now available to help MTC and transportation agencies plan for a more efficient and more effective regional transportation network. The dashboard allows users to explore how travel patterns — such as mode share, trip rates, trip purpose, trip lengths, working from home, and home delivery — vary across counties and demographic groups.
The dashboard focuses on data from 2019 and 2023, highlighting how travel behavior changed before and after the pandemic. Travel study participants were invited using a random sampling procedure to represent the Bay Area's population. They used a smartphone app to log their daily travel for up to seven days. The app combined passively collected time and location data with participant-reported trip purpose, travel mode and demographic information, creating a rich travel diary of how people move around the region. About 4,500 households participated in 2019 and roughly 8,000 households participated in 2023, providing a robust sample for understanding regional travel patterns.
Knowing more about who travels, and how and why they go from place to place, will help MTC and other agencies develop policies and make informed transportation investments. More information about the Bay Area Travel Study and data may be found on the MTC website at: https://bats2019-2023.mtcanalytics.org/.
Submit your comment
In order to receive a reply to your comment, please provide an email address.